What Exactly is the Bitcoin Rainbow Chart?
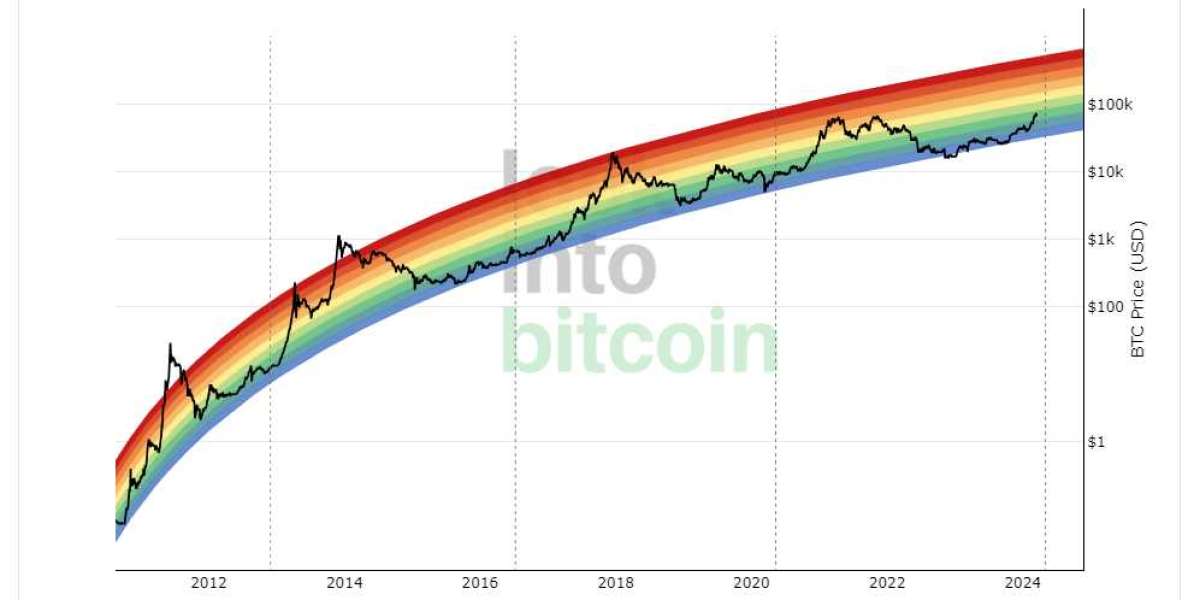
The Bitcoin Rainbow Chart isn't your typical technical analysis tool. It's not a moving average crossover strategy or a Fibonacci retracement level. Instead, it's a visually striking representation of Bitcoin's long-term valuation. The chart, adorned with vibrant rainbow-colored bands, serves as a logarithmic growth curve, offering a unique perspective on Bitcoin's potential future price direction.
Peeking Behind the Rainbow
The Rainbow chart isn't just a product of whimsy; it's grounded in mathematical precision. Utilizing a logarithmic growth curve, this chart provides a holistic view of Bitcoin's historical price movements within a defined channel. However, it's essential to note that while past performance can offer insights, it's no crystal ball for predicting the future trajectory of Bitcoin's price.
Interpreting the Spectrum
So, how does one decipher the hues of the Bitcoin Rainbow Chart? Each color band represents a distinct phase in Bitcoin's market sentiment and valuation. Warmer colors indicate periods of potential overheating, suggesting that strategic investors might consider capitalizing on profits. Conversely, cooler colors signify market downturns, presenting opportunities for accumulation.
Navigating the Rainbow
For those delving into the Bitcoin Rainbow Chart, it's crucial to tread cautiously. While it offers valuable insights into market sentiment, it's not without its limitations. This chart relies solely on historical price data, devoid of insights from blockchain activity or market participants' behavior. Moreover, it's important to remember that the Rainbow Chart is more of a meme than a rigorous investment strategy.
Closing Thoughts
In the volatile realm of cryptocurrency investing, tools like the Bitcoin Rainbow Chart offer a splash of color amidst the chaos. While it's not a crystal ball, it provides investors with a unique perspective on Bitcoin's long-term valuation trends. As with any investment tool, it's essential to approach it with caution and supplement it with comprehensive research and analysis.
So, the next time you find yourself lost in the sea of Bitcoin price charts, don't forget to look for the rainbow – it might just lead you to a pot of digital gold.
Remember, investing in cryptocurrency carries inherent risks, and it's essential to conduct thorough research and consult with financial professionals before making any investment decisions.
Disclaimer: The information provided in this article is for educational and entertainment purposes only and should not be construed as financial advice. Always conduct your research and consult with a qualified financial advisor before making investment decisions.


