What is Stock-to-Flow (S2F)?
The Stock-to-Flow model is a forecasting tool used to estimate the value of an asset based on its scarcity relative to its production rate. In the context of Bitcoin, it compares the existing supply of bitcoins (the stock) to the amount produced (mined) each year (the flow). This model suggests that assets with higher Stock-to-Flow ratios are likely to have higher values.
Understanding the Model
Bitcoin's Stock-to-Flow model, introduced by the pseudonymous analyst PlanB, treats Bitcoin as a "store of value" similar to commodities like gold and silver. Bitcoin's scarcity is enforced by its predetermined supply schedule and the computational effort required for mining. As Bitcoin's supply rate decreases over time due to halving events (where mining rewards are reduced by half), its Stock-to-Flow ratio increases, indicating higher scarcity and potentially higher prices.
How Does it Work?
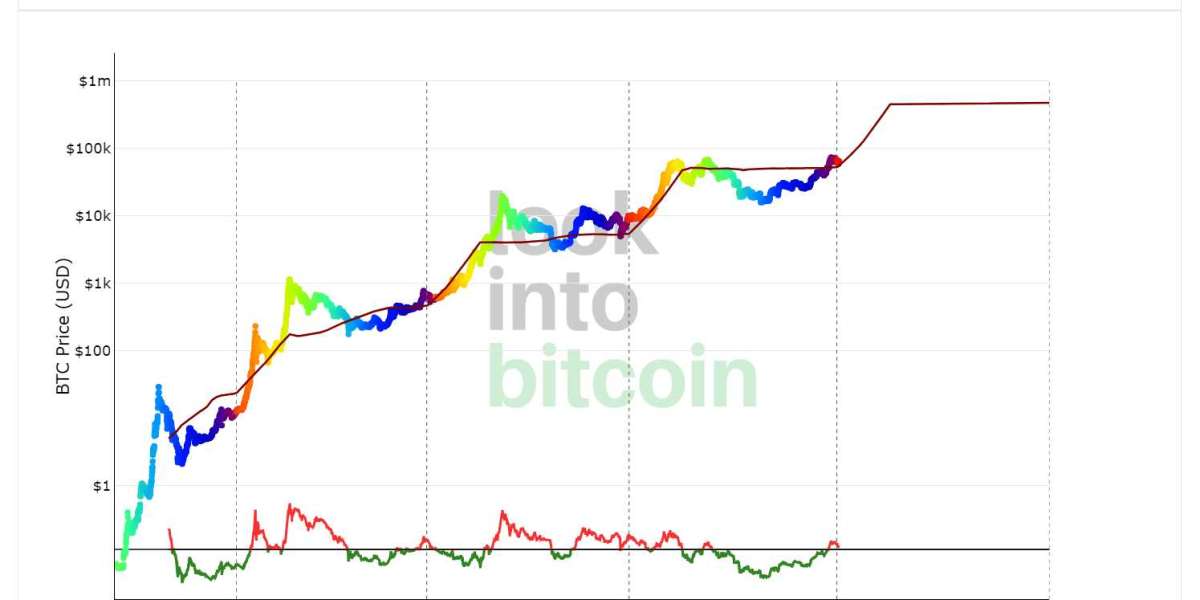
The Stock-to-Flow model creates a line on a chart that represents the estimated price level of Bitcoin based on its scarcity. The line shows the forecasted price at a given time, calculated by dividing the total supply of Bitcoin by the annual production. As the supply of new bitcoins decreases over time, the Stock-to-Flow ratio increases, implying a higher forecasted price for Bitcoin.
Implications for Investors
Investors and traders use the Stock-to-Flow model as a tool to forecast future Bitcoin prices. By observing the projected Stock-to-Flow line on a chart, they can anticipate where the price of Bitcoin may go. The model has historically provided accurate forecasts, with Bitcoin's price closely following the Stock-to-Flow trajectory.
Viewing the Chart
On a Stock-to-Flow chart, the Bitcoin price is overlaid on top of the Stock-to-Flow ratio line. The chart typically incorporates indicators such as Bitcoin halving events, which occur roughly every four years and increase Bitcoin's scarcity. By observing the relationship between price and the Stock-to-Flow line, investors can gauge market cycles and potential price movements.
Data Source and Prediction
The Stock-to-Flow chart utilizes data from Bitcoin's supply schedule, which is built into the Bitcoin code. This data is used to create the Stock-to-Flow values displayed on the chart. According to the model, Bitcoin's price is projected to increase over time as its scarcity rises. For instance, the model predicts a significant jump in Bitcoin's price by the end of 2024.
Criticisms and Limitations
Despite its predictive power, the Stock-to-Flow model has faced criticism for oversimplifying the dynamics of asset valuation. Critics argue that factors beyond scarcity, such as demand and market sentiment, also influence prices. Additionally, the model's reliance on past data to predict future prices may not always hold true in rapidly evolving markets.
Conclusion
The Stock-to-Flow model offers valuable insights into Bitcoin's scarcity and potential price trajectory. While it has been effective in forecasting Bitcoin's price movements, investors should use it alongside other indicators and consider its limitations. Nonetheless, the Stock-to-Flow model remains a powerful tool for understanding the fundamental drivers of Bitcoin's value and anticipating future market trends.


