Greetings, friends and speculators.
Let's take a moment to examine the Crypto King's relationship with the 2-month RSI indicator.
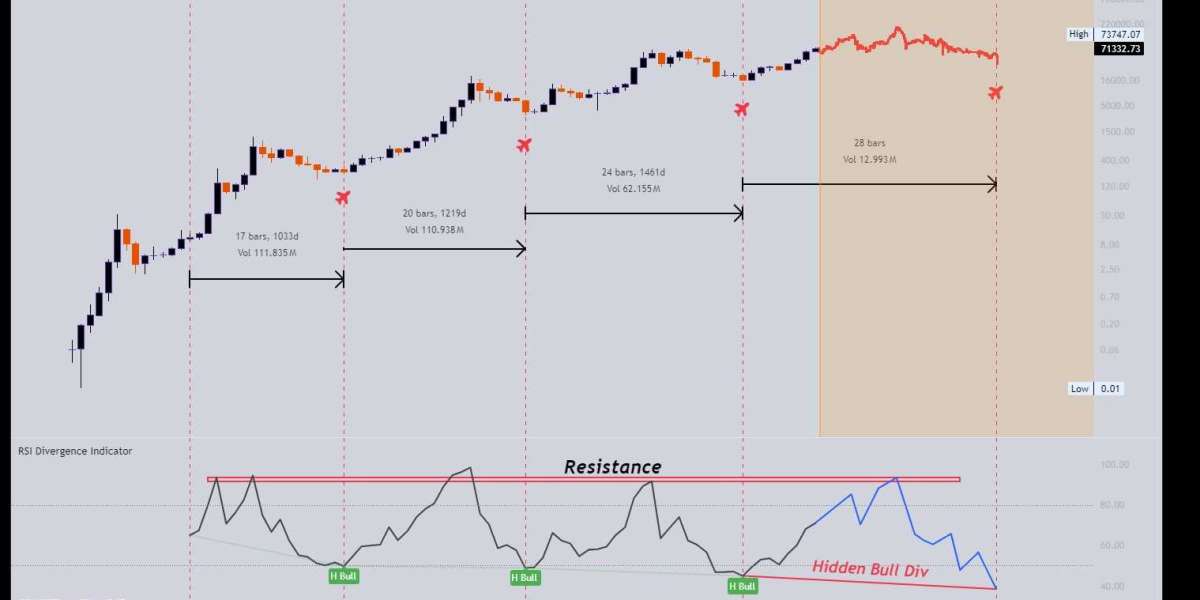
The RSI has proven itself as a powerful tool, accurately identifying the exact bottom on three separate occasions.
During the bear market lows of 2015, 2018, and 2022, a hidden bullish divergence emerged, signaling the conclusion of the downtrend and the initiation of a new "MarkUp" Phase.
Interestingly, there has been an approximately 20% increase in the duration between these hidden bullish divergences. If we extrapolate this trend to the current period, we might anticipate a market bottom around July 2027.
However, approach this prediction with caution, past performance does not guarantee future returns.
To confirm a valid Hidden Bullish Divergence, the bulls need to maintain the price above the 2022 lows while ensuring that the RSI makes a lower low.
Apart from indicating market bottoms, the RSI indicator also aids in pinpointing optimal exit points. Notably, RSI levels surpassing 90 historically denoted the conclusion of the bull run.
With the current RSI hovering around the 70 mark, it suggests that the bulls still possess plenty of ammunition as they advance further.
I should note that RSI has made a lower high during the last 2 market tops, one could assume that a lower high in this bull frenzy would fail to penetrate the 90+ level.
If you recall my BTC post from September 2021, I advised bulls to start dollar-cost averaging into positions.
At that time, BTC was experiencing an "Accumulation" phase, and it's clear that we've transitioned into a "MarkUp" phase now.
As we approach the final Bitcoin halving, there is no doubt that an interesting time is upon us.
To all those who weathered the brutal bear market, I salute you.
Much Love and Good Luck!
What is Hidden Bullish Divergence?
A hidden bullish divergence is a setup where the oscillator forms lower lows at the same time that the price is forming higher lows.
This setup is frequently seen in situations where the price has been in consolidation or has performed a pullback from an uptrend.
What is RSI?
The Relative Strength Index, or RSI for short, is one of the most popular technical indicators among the trading community. It belongs to the family of oscillators, or technical tools used to determine overbought or oversold conditions. It’s used to gauge the market sentiment.
Developed by J. Welles Wilder, the RSI measures the speed and change of price movements.
A popular way of reading RSI values is to look for divergences that occur when a new high or a new low of the price isn’t confirmed by the RSI readings.
Readings close to 0 are viewed as “oversold”, while those closer to 100 are a sign of “overbought” market conditions. Unlike some other momentum indicators, readings can’t go below 0 or higher than 100.
Speculative Setup, DYOR + Due Diligence


